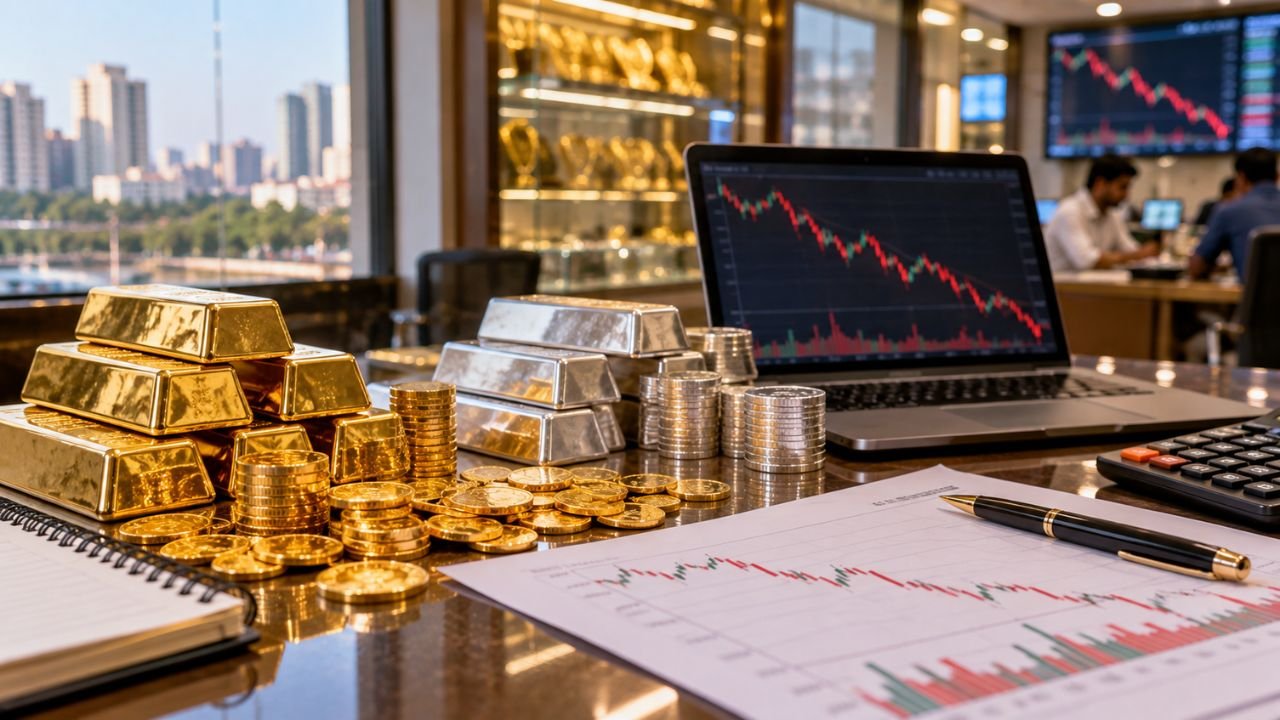
Gold and Silver Prices September 29, 2026, show a sharp technical correction in major Indian cities, including Surat, Ahmedabad, Mumbai and Delhi. Both metals have moved down from their recent highs and are trading around the levels highlighted in the current market analysis. The fall comes amid rising US Treasury yields, a strong US dollar, higher crude oil prices and expectations of further US Federal Reserve rate hikes. In this article, you will find the city-wise gold and silver rates for September 29, 2026, along with the key technical levels, market drivers and factors that could shape the next phase of the correction.
Gold and Silver Rates in Surat, Ahmedabad, Mumbai and Delhi
Bullion prices can vary slightly between cities because of factors such as local demand, transportation costs and state taxes. The following rates are the retail price ranges given for September 29, 2026, excluding GST.
| City | 22K Gold per 10g | 24K Gold per 10g | 999 Silver per kg |
|---|---|---|---|
| Surat | ₹1,40,600 | ₹1,52,700 | ₹2,40,000 |
| Ahmedabad | ₹1,40,600 | ₹1,52,700 | ₹2,40,000 |
| Mumbai | ₹1,40,613 | ₹1,52,740 | ₹2,40,000 |
| Delhi | ₹1,40,405 | ₹1,52,514 | ₹2,40,000 |
These are the stated retail rates before GST and local making charges. Retail jewellery showrooms may also apply 3% GST and local making charges, so the final amount paid for jewellery can differ from the bullion rate shown above.
Surat Gold Rate on September 29, 2026
In Surat, the stated rates are ₹1,40,600 per 10 grams for 22K gold, ₹1,52,700 per 10 grams for 24K gold and ₹2,40,000 per kilogram for 999 silver. The Surat rates are largely similar to the Ahmedabad rates in the provided market figures, which suggests that bullion pricing in both cities is moving in close alignment under the current market conditions.
Ahmedabad Gold Rate on September 29, 2026
The stated Ahmedabad rates are ₹1,40,600 per 10 grams for 22K gold, ₹1,52,700 per 10 grams for 24K gold and ₹2,40,000 per kilogram for 999 silver. The figures indicate only a small difference between the listed gold rates in Ahmedabad and the other major cities, which is typical when city-level demand and local charges remain broadly stable.
Mumbai Gold and Silver Rates
Mumbai’s stated rates are ₹1,40,613 per 10 grams for 22K gold, ₹1,52,740 per 10 grams for 24K gold and ₹2,40,000 per kilogram for 999 silver. The Mumbai figures are slightly higher than the corresponding Surat and Ahmedabad gold rates in the provided data, which is consistent with Mumbai’s position as a major bullion trading centre in India.
Delhi Gold and Silver Rates
Delhi’s listed rates are ₹1,40,405 per 10 grams for 22K gold, ₹1,52,514 per 10 grams for 24K gold and ₹2,40,000 per kilogram for 999 silver. Among the four cities listed, Delhi has the lowest stated 22K and 24K gold rates in this particular comparison, while the silver rate remains the same across all cities.
Gold and Silver Are in a Correction Phase
The current market movement shows a notable pullback from the late-August and early-September peaks. The 24K gold and silver futures discussed in the market analysis have moved lower from their earlier highs, and the correction has brought both metals closer to the levels identified as current support areas in the provided technical outlook. This phase follows a strong rally, and the market is now testing whether buyers will step in at these lower levels or whether the correction will extend further.
Gold Technical Outlook
MCX October gold futures have fallen by roughly 8% from their previous highs and moved below the ₹1.50 lakh level. The market analysis describes the near-term bias as sideways to bearish. The immediate technical resistance area is placed between ₹1,49,500 and ₹1,51,800, while the technical support area is identified around ₹1,44,000 to ₹1,45,000. These levels are technical reference points mentioned in the provided market analysis and do not guarantee future price movements. Traders and buyers often watch these zones closely to assess whether the metal is finding a base or preparing for another leg down.
Silver Technical Outlook
Silver has experienced wider price swings compared with gold during the correction. The ₹2,25,000 per kg level is identified as an important near-term floor in the provided analysis, and silver is currently described as consolidating around the ₹2,35,000 to ₹2,40,000 range. A move below ₹2,25,000 would represent a further weakening of the correction according to the technical outlook provided. The upside resistance levels mentioned are ₹2,42,000 and ₹2,48,000, which would need to be cleared for silver to regain a more positive short-term trend.
What Is Driving the Gold and Silver Correction?
Several macroeconomic factors are highlighted in the current market discussion. Together, these factors have shifted investor sentiment away from precious metals in the short term and pushed both gold and silver into a correction phase after their recent rally.
Rising US Treasury Yields
Higher US Treasury yields can influence investor demand for non-yielding assets such as gold and silver. The current market environment includes rising US Treasury yields, which has added pressure to precious metals. When yields rise, the opportunity cost of holding gold and silver increases, which often leads to lower demand from investors looking for regular returns.
Strong US Dollar
A strong US dollar is another factor mentioned in the market outlook. Changes in the dollar can affect internationally traded commodities, including precious metals. Since gold and silver are priced in dollars globally, a stronger dollar makes them more expensive for buyers using other currencies, which can weigh on prices.
Higher Crude Oil Prices
Crude oil prices have also risen sharply in the current market environment described in the provided information. The rise in oil prices has increased concerns about inflation and has influenced expectations around US monetary policy. Higher oil prices can feed into broader inflation, which in turn affects how central banks approach interest rates.
Federal Reserve Rate Expectations
The market outlook also points to expectations of further Federal Reserve rate hikes. The combination of interest-rate expectations, Treasury yields and dollar strength has contributed to the pressure on gold and silver described in the current analysis. When rate hike expectations rise, non-yielding assets like gold and silver typically face headwinds.
Geopolitical and Oil Market Factors
The provided market outlook also highlights geopolitical tensions around the Strait of Hormuz. Brent crude is described as trading above the $100 to $107 per barrel range in the discussion. The higher oil prices have contributed to concerns about inflation and have affected the flow of capital between different asset classes. These geopolitical developments add another layer of uncertainty to the market and can influence how investors position themselves in gold and silver.
Gold and Silver Price Movement in September
The provided price-action chart shows both 24K gold and 999 silver moving downward during the latter part of September. The chart tracks the movement from September 15 through September 29, 2026. Gold reached a correction peak around ₹1,59,980 per 10 grams in the chart before moving lower, and by September 29, the 24K gold price shown is around ₹1,52,700 per 10 grams. The silver line also shows a downward movement during the period, moving toward the support area highlighted in the analysis.
Key Technical Levels to Watch
The provided analysis identifies several price levels for gold and silver.
| Metal | Key Level | Description |
|---|---|---|
| Gold | ₹1,44,000–₹1,45,000 | Support area |
| Gold | ₹1,49,500–₹1,51,800 | Resistance area |
| Silver | ₹2,25,000 | Important near-term floor |
| Silver | ₹2,35,000–₹2,40,000 | Current consolidation area |
| Silver | ₹2,42,000 | Resistance |
| Silver | ₹2,48,000 | Higher resistance |
These are technical levels discussed in the supplied market analysis and should be viewed as market reference points rather than guaranteed future price levels.
What the Market Outlook Says About Buyers
The provided market analysis discusses a staggered approach for buyers rather than deploying all available capital at once. It mentions using a staggered or Systematic Investment Plan approach for people accumulating gold and silver through coins, bars or digital gold. The analysis also identifies the following levels for monitoring: gold around ₹1,45,000 per 10 grams and silver around ₹2,25,000 to ₹2,28,000 per kilogram. These points are part of the supplied market strategy discussion and are not a personalised investment recommendation.
What the Market Outlook Says About Sellers
For people holding longer-term positions, the supplied analysis cautions against panic liquidation during the current correction. It also discusses a different approach for short-term traders, where sudden price rallies may be considered in the context of temporary holdings and short-term market momentum. The market outlook remains sensitive to changes in major economic and geopolitical factors, so sellers may need to watch these developments closely before making any decision.
Economic Data and Global Developments to Watch
The supplied analysis identifies several factors that could influence the next phase of gold and silver prices. These include US nonfarm payroll data, US employment data, changes in energy prices, developments around the Strait of Hormuz, US Federal Reserve policy, US Treasury yields and movement in the US dollar. Changes in these factors could affect the direction of precious metals during the ongoing correction.
Gold and Silver Prices September 29, 2026: Key Points
- Gold and silver are undergoing a technical correction in late September 2026
- The correction follows declines from recent highs
- Surat’s stated 24K gold rate is ₹1,52,700 per 10 grams
- Ahmedabad’s stated 24K gold rate is ₹1,52,700 per 10 grams
- Mumbai’s stated 24K gold rate is ₹1,52,740 per 10 grams
- Delhi’s stated 24K gold rate is ₹1,52,514 per 10 grams
- The stated 999 silver rate is ₹2,40,000 per kg across all four cities
- The listed retail rates exclude GST
- Jewellery purchases may also include 3% GST and local making charges
- MCX October gold futures are described as roughly 8% below their previous highs
- Gold’s technical resistance is identified around ₹1,49,500 to ₹1,51,800
- Gold’s support area is around ₹1,44,000 to ₹1,45,000
- Silver’s important near-term floor is identified at ₹2,25,000 per kg
- Silver is described as consolidating around ₹2,35,000 to ₹2,40,000
- Silver resistance levels are identified at ₹2,42,000 and ₹2,48,000
- Rising US Treasury yields, a strong dollar and higher crude oil prices are among the macro factors highlighted in the market outlook
- US employment data, energy prices and geopolitical developments are among the factors being watched
What Buyers and Sellers Need to Know
For anyone tracking Gold and Silver Prices September 29, 2026, the key points to remember are simple. City-wise rates vary slightly, and the final cost of jewellery can be higher because of GST and making charges. The current market is in a correction phase, and the technical levels discussed here are reference points, not guaranteed future prices. Buyers may consider a staggered approach rather than investing all at once, while long-term holders are advised against panic selling. Short-term traders may look at rallies differently depending on market momentum. Since global factors such as US Treasury yields, the dollar, crude oil and Federal Reserve policy are driving the current trend, keeping an eye on these developments can help readers understand where prices may move next.
Conclusion
The Gold and Silver Prices September 29, 2026, market is showing a clear correction after the strong price levels reached earlier in the month. The stated retail rates for Surat and Ahmedabad stand at ₹1,40,600 for 22K gold and ₹1,52,700 for 24K gold per 10 grams, while 999 silver is listed at ₹2,40,000 per kilogram. Mumbai and Delhi show only small differences in the quoted gold rates. The current technical analysis identifies important support and resistance levels for both metals, while global factors such as US Treasury yields, the dollar, crude oil prices and Federal Reserve expectations remain central to the market discussion. For readers tracking gold and silver, the key point is that prices can vary by city and final jewellery costs can also include GST and making charges. The technical levels and market factors discussed here describe the current market situation but do not guarantee how prices will move next.
Frequently Asked Questions
Q1. What are the gold rates in Surat and Ahmedabad on September 29, 2026?
A1. In both Surat and Ahmedabad, the stated rates are ₹1,40,600 per 10 grams for 22K gold and ₹1,52,700 per 10 grams for 24K gold, excluding GST and making charges.
Q2. What is the silver rate across major Indian cities on September 29, 2026?
A2. The stated 999 silver rate is ₹2,40,000 per kilogram across Surat, Ahmedabad, Mumbai and Delhi, before GST and local charges.
Q3. Why are gold and silver prices falling on September 29, 2026?
A3. The correction is driven by rising US Treasury yields, a strong US dollar, higher crude oil prices and expectations of further US Federal Reserve rate hikes, all of which have added pressure to precious metals.
Q4. What are the key technical levels for gold and silver right now?
A4. Gold has support around ₹1,44,000 to ₹1,45,000 and resistance around ₹1,49,500 to ₹1,51,800. Silver has an important near-term floor at ₹2,25,000 per kg, consolidates around ₹2,35,000 to ₹2,40,000, and faces resistance at ₹2,42,000 and ₹2,48,000.
Q5. Do the listed gold and silver rates include GST and making charges?
A5. No, the listed rates are retail bullion rates that exclude GST and local making charges. Jewellery purchases may attract 3% GST and additional making charges, so the final amount paid can be higher than the rates shown.